Overview
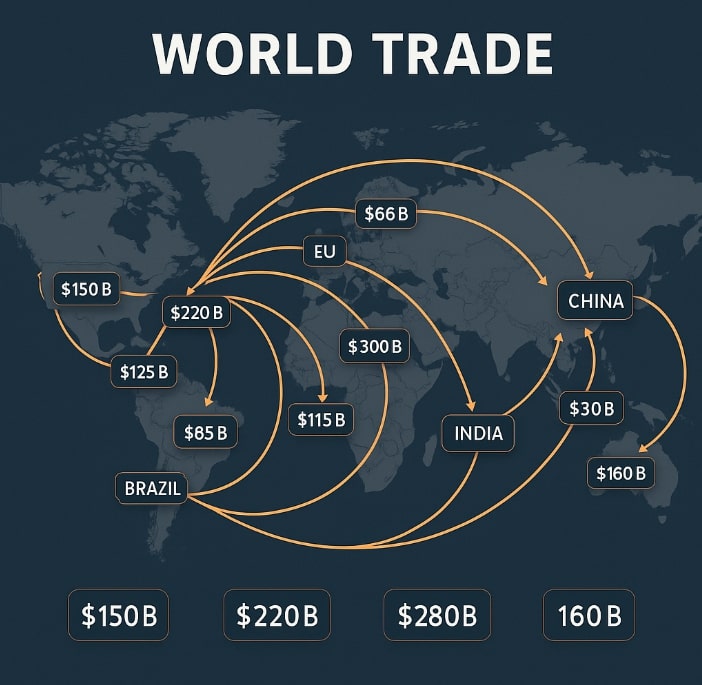
The Geo-Political Dashboard visualizes India's trade relationships with countries worldwide, providing insights into import-export patterns, trade balances, and economic trends. This interactive tool helps policymakers, researchers, and businesses understand global trade dynamics.
Key Features
- Interactive world map with color-coded trade intensity
- Time-series analysis of trade volumes and balances
- Commodity-wise breakdown of imports and exports
- Trade deficit/surplus visualization by country
- Predictive analytics for trade trend forecasting
- Customizable report generation
Technical Implementation
Built with Python and Pandas for data processing, the dashboard uses D3.js and Plotly for interactive visualizations. The system processes complex trade data from multiple sources, normalizes it, and presents insights through an intuitive interface. The architecture supports real-time updates as new trade data becomes available.
Impact
This dashboard has been instrumental in identifying emerging markets, optimizing trade strategies, and informing policy decisions. It provides a comprehensive view of India's global trade position and helps identify opportunities for economic growth and development.